Saving money on groceries with an LLM
The spending problem
My family spends more than 600 € in supermarkets in most months. It isn’t just food. It’s everything we get from a supermarket, including cleaning products and some cosmetics. I think it’s a lot and my goal is to push it below 600 €.
A few months ago I uploaded a photo of a receipt from a larger weekly shop to an LLM. I asked it for feedback and ways to decrease the cost. I did this a few times. I implemented some changes, but they didn’t have any significant impact. In fact, September (I’m writing this in October) had the third-highest supermarket spend in the more than 3 years I’ve been tracking our spending.
Note: when we travel abroad, I log grocery spending under the category dedicated to the trip, like “Copenhagen 2026”, not under “Supermarket/groceries”. Because of that, July this year had the second-lowest supermarket spend ever. We were in Copenhagen most of the month, and I assume it was our highest ever grocery spend.
Would you like a receipt? Yes!
To get actionable insights into our grocery spending, I needed to know how much we spend on which products over a longer period of time. I started collecting all the receipts and decided that at some point I would create a system to analyze them.
Thanks to an AI coding assistant, it was easier than I thought. Below is how it works. Skip to the next section if you want to read what I learnt from the data.
- I put all receipts into a receipts/inbox folder.
The supermarket chain where I do the most shopping sends the receipt to my email the moment I pay by card. I download the PDF to the receipts inbox. For other places, I take a photo of the receipt and save it to the same folder. Syncthing syncs the folder between my Linux laptop and iPhone.
- Every 5 minutes, a Python app runs. It uses an LLM to parse (read and structure) the files in the receipts inbox and saves them in an SQLite database
receipts.db. It has 2 tables. The table for the receipts stores the shop’s name, the total amount, and other data from the receipt. The products table stores the name of the product as it was printed on the receipt, but also aname_norm. The normalized name allows me to unify products with different names into a single name. For example, tomatoes come in different varieties, but I only want to see “tomatoes” in the analysis. Furthermore, each shop labels the same product in whatever way they like, and I need to merge it into a single name. - To analyze our supermarket spending, I query the database with SQL. Most of the time I tell the coding assistant what I need. It then writes the query and outputs the result. I also asked the assistant to maintain a “cheatsheet” from which I can copy a query and paste it into the terminal. This is so that I don’t have to use an LLM each time I need to run the same or similar query. It also helps me learn SQL and not over-rely on AI.
Don’t take delicious croissants from me
I can’t call this section “the results” because I need to wait around 2 months to see our supermarket spending trend. But I’ve already learned a few things.
The key learning isn’t about spending behaviour. It’s about (not) delegating the thinking to an LLM. I asked it to look at the data and find some insights. The prompt:
- What other insights do you see in the august and september shopping?
- What might be adding a lot to the spend for lower value?
- What cheaper alternatives do you see that I could implement?
- What’s getting more expensive, or where does the price change over?
The final output was a well-structured document with a breakdown by category, price comparisons and tips for optimization. There were a few things that the LLM presented as insights and tips. Some were worth thinking about. And some missed the mark because the LLM lacked context. 2 examples:
- A croissant from Supermercados Martinez is 40 cents more expensive than the one from Mercadona, but the taste is so much better. I bought 7 of them at Martinez. So the insight is that I spent 2.80 € more when I opted for much tastier croissants. That’s not an insight, that’s noise.
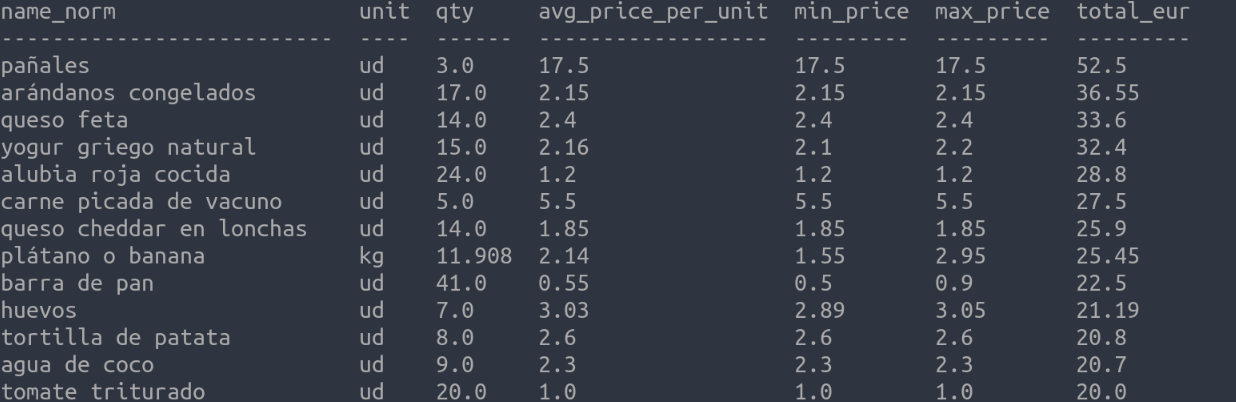
- The LLM’s tip: “A tortilla at €2.60 is mostly eggs and potato. Homemade costs a fraction of that.” — I don’t agree. Ready-made tortilla de patatas is the best convenience food. It’s tasty, cheap and I can’t justify making it on my own from scratch.
How many blueberries can a 2-year-old eat
I knew from the beginning that the most useful thing for me would be a simple list of all products, sorted by their total cost. After polishing (renaming, merging) the data, I placed the laptop on the dining table. Kristina sat beside me and we looked at the list during lunch. Soon, we saw a few opportunities where we could cut costs. And the LLM couldn’t have seen what we did:
- That a 2-year-old consumed 17 packs of frozen blueberries (36.55 €). Okay, the parents helped a little. But still…
- An expense of around 25 € a month will go away when our son stops wearing a nappy. A good financial incentive.
- Even though we love coconut water and orange juice, we don’t need them. Unless we are dehydrated after stomach problems (coconut water helps). 30 € in 2 months.
- We use too many paper towels. 24 rolls, 100 sheets each. 18 € in 2 months.
- 2 guilty pleasures, 1 per adult — 4 jars of peanut butter (me, though some of it goes to Asian recipes) and 5 jars of hazelnut-cocoa cream (her, with a bit of my “help”). 24 € in 2 months.
Conclusion
I’m happy to finally see more detail about our supermarket spend. Setting this up was worth the time and money. Yes, there is some cost — $3.40 in 2 months for the LLM’s API. Sometimes processing the receipts failed (missing date, duplicate receipts) and the frequent retries used tokens. So I’m optimizing the tool further. That’s easy with the coding assistant. I expect the monthly cost to be below $1 after the improvements. I hope it will be insignificant compared to the savings I get thanks to the insights.